
Mean time to recovery (MTTR) is a crucial metric by which software operations teams determine how well they’re responding to incidents. MTTR is a metric that measures the time from when an incident is first identified until the incident is fully recovered from. Because this metric encompasses the entire length of the incident, it’s an important metric to track, as any improvements in the incident management process will be reflected in a shorter MTTR.
Reducing your MTTR means that any incidents that do come about are resolved more quickly and efficiently, allowing both your customers and your ops team to get back to normal.
In this article, you’ll take a look at what contributes to MTTR, and how you can reduce MTTR within your organization.
What is MTTR?
MTTR is a measurement of the average length of time it takes a system or product to recover from an outage, from the point of failure to full resolution. Because of this, it’s a useful metric to determine just how effective and stable a given DevOps team is. It’s important to note that although MTTR can be a good metric for deciding that processes need to be more efficient, it’s a relatively high-level metric that doesn’t do much to tell you what specific piece of your incident resolution process needs to be fixed. That said, it is still a very useful metric and having a low MTTR is a good goal for any DevOps team.
Read more:
- Our in-depth blog on 13 DevOps KPIs every leader should track
- What are DORA metrics?
The fact that MTTR measures the entire lifecycle of an incident makes it one of the most comprehensive incident metrics there is. The clock starts when an issue is identified. This includes the person who initially discovered the issue trying to find a reproducible test case, writing up the issue, and disclosing it to a broader incident-management team. From there, the incident-management team will work on a patch for the problem, deploy it to production, and ensure that all normal function has been restored. Because all of these stages are included in the MTTR calculation, improvements at any stage will help a team reduce its MTTR and result in a smoother incident management process all around.
Why Use MTTR?
Incidents are stressful, and without quantifiable data about how an incident was handled, it can be difficult to be objective about whether your team is managing them well or improving their management over time. Having a metric like MTTR, which gives a clear measurement of how long incidents tend to affect your codebase and whether incident time is increasing or decreasing, is key to enabling an objective assessment of the incident management process.
Helps Track Reliability
Over a long enough period of time, MTTR shows how reliable your application is, as well as how effective your incident management process is. A low MTTR means your application is more stable and can recover quickly from incidents when they occur. Over time, this stability and the ability to quickly resolve issues will decrease your application’s downtime. The decreased downtime benefits both your end users and your DevOps team, who will have to spend less time debugging and fixing issues.
Read more: How to Measure Change Failure Rate?
Offers Insight Into Potential Process Improvements
While MTTR isn’t able to diagnose issues in your incident management process, keeping an eye on this important metric can alert you to the fact that something needs to be fixed. You can then use further tools and incident management processes to make a determination about exactly where to spend your efforts, but if your MTTR is consistently high over a period of time, this might point to the fact that some changes need to be made.
Looking a bit deeper, it might become obvious that debugging an incident is where most of your time is spent. In this case, investing in a tool that can help you tie errors to specific portions of the codebase might help you reduce your MTTR. If you’re frequently seeing incidents due to existing functionality breaking when new functionality is added, this could be a sign that you need to add automated testing to new features before they’re shipped. This way, if there is going to be an issue with new code, the automated tests will fail, and any breakages can be resolved before the bad code is deployed to production.
Tracks Performance Improvements
Once you’ve decided that improvements need to be made and start refining your processes, MTTR is a great metric to use to track your progress. If your MTTR is reduced as a result of the changes you’ve made, you’re generally on the right track. An important consideration here is to not look at the recovery time of a single incident, but across a longer time period, both before and after the changes that you’ve made. If your MTTR does not decrease as a result of the process changes you’ve made, that doesn’t automatically indicate that they weren’t necessary changes, but it can be an indication that the true bottleneck to finding and fixing issues faster is somewhere else in your process.
How Do You Lower MTTR?
Once you’ve identified that your MTTR is higher than you would like it to be, you need to actually take the steps to improve it. One of the ways you can start down this path is by focusing on your DevOps pipeline, and any inefficiencies or frequent breakages that might be there. This is where a continuous orchestration platform like Opsera can be very useful. Let’s take a look at just how a platform like Opsera can help you track your improvement efforts and help reduce your MTTR over time.
Identify Problems Faster
Especially as your systems become more and more complex, much of the time dedicated to resolving an incident comes from the identification phase, where you’re either still realizing that an issue exists or responding to a report of an issue and trying to track down just what’s going on. By using a platform like Opsera to look through your logs and analytics, especially as they relate to your deployments and pipelines, you can more easily tie errors to a given deployment. Once you know exactly where the issue originated, you can then choose to either roll back or fix the underlying issue.
In addition, a well-structured deployment pipeline can run pre-deployment checks to identify issues via automated tests before they’re deployed, and can run post-deployment checks by running performance or uptime checks, automatically triggering rollbacks if required. Both of these strategies help ensure that your service has the highest uptime possible, while also reducing the impact of incidents when they do occur.
Improves Visibility Into Potential Improvements
As discussed above, MTTR isn’t a great metric for determining what needs to be improved—it’s more of a measure for determining that something needs to change, then tracking the effects of any changes made. The gap in the middle is where a platform like Opsera comes in. Opsera gives you visibility into your entire deployment pipeline before, during, and after a deployment. This means you have fine-grained insight into places where bugs or breakages might get introduced. (Read more: What is DevOps observability?)
For example, if you’re frequently shipping code that’s causing major incidents and you see that your unit tests for a particular piece of your app are frequently failing, this should be investigated. In the case of a specific fragile component of your application, it would be worth spending some time refactoring this component to be more stable and remove some of the technical debt that may be present there.

Reducing MTTR with Opsera
One of the most common challenges when it comes to debugging a CI/CD pipeline is just finding out where to look for the information that you need to resolve things. With many teams using upwards of ten tools in their pipeline, the first step to resolving an issue is simply locating it. While this is obviously increased by the number of tools used, it’s also increased by the need to correlate issues, which can be really difficult when all your data is siloed, so you have to go through the logs for each tool, one by one.
Opsera allows you to create your entire pipeline and integrate all of your tools with a single, easy-to-use, drag-and-drop interface. After that, things are really integrated, not just working alongside each other. One effect of this is that you’re able to see all the logs for all your tools in the same place, presented so that correlations in the logs are clearly visible. This gives you a comprehensive overview of what was happening across your entire pipeline, not in just a single spot. You can also see historic logs, which makes it easy to compare how things are working to how they were working previously, making finding the source of the incident faster and easier.
In addition to end-to-end visibility for your pipeline, Opsera also offers not just logs, but actionable insights from those logs. This can be set up with your alerting system, hooking into common communication platforms such as Slack and Microsoft Team. You can also construct templates that will download the alerts and add them to Jira tickets or similar tracking software, giving you a comprehensive, audit-ready log.
Thanks to the number of tools that it integrates with out-of-the-box, Opsera allows for painless, no-code construction of even the most complex pipelines, complete with visibility and alerting. This allows you to greatly reduce the amount of time that you spend not just constructing and maintaining your pipeline, but also how long it takes to identify an issue and begin moving towards resolution. Some companies have found that the move to Opsera, without any other changes, has reduced their MTTR by as much as twenty percent.
Track MTTR Improvements
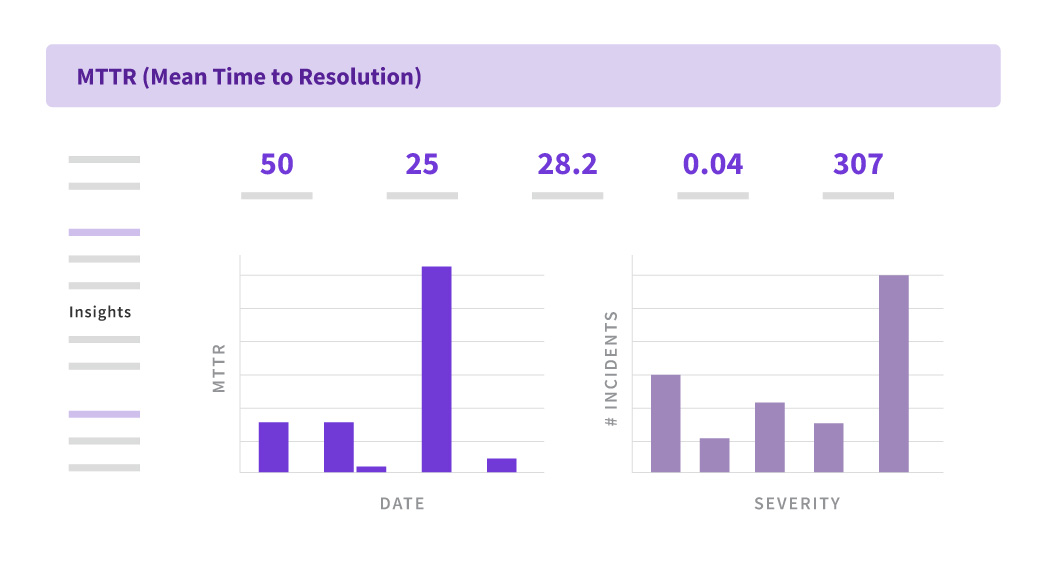
In addition to helping you work through the process of reducing your MTTR, a platform like Opsera also tracks your MTTR over time, allowing you to easily see whether the improvements you have been making are having an effect on the metrics as you’d like them to. While it’s possible to track MTTR and other important metrics like this manually, having a platform that’s connected to your code and to your infrastructure is easier to track and more accurate than doing it by hand.
Wrapping Up
While mean time to recovery (MTTR) is just one metric in a DevOps team’s toolbox, it’s one of the most comprehensive, because it encompasses the entire incident, from first identification all the way through to resolution when all systems have recovered and returned to normal. Using an orchestration platform like Opsera to manage your deployments not only helps you catch problems that may lead to incidents before they get deployed to production, it can also help you debug and recover from incidents after they happen.
By helping you pinpoint exactly what is causing a given issue and giving you the tools to allow you to recover quickly, Opsera can help you make your service more stable, help your team recover from incidents quickly, and reduce your MTTR over the long run. This results in more stable software, giving your customers more confidence in your product, and allowing your DevOps team to more confidently and efficiently respond to incidents when they do come up.